Search Archives
Contributors
  • Bill Chuck - Managing Editor
  • Dave Golebiewski
  • Daniel McCarthy
  • David Pinto
  • Jonathan Scippa
Follow Us

Featured Sponsors


What's New

Mailing List
Email Newsletter icon, E-mail Newsletter icon, Email List icon, E-mail List icon Sign up for our Email Newsletter
For Email Marketing you can trust
Twitter Feeds

This site utilizes the MLB analytics platform powered by TruMedia Networks

Entries in Tim Lincecum (17)

Wednesday
Aug142013

The Freak Getting Hitters to Chase 

While the San Francisco Giants won't have the chance to defend their World Series title this October, Tim Lincecum has plenty riding on the rest of the 2013 season.

The 29-year-old righty hits the free agent market this winter sporting two Cy Young Awards but also a combined 73 ERA+ over the 2012-13 seasons, worst among starting pitchers throwing at least 300 innings over that time frame. From 2007-11, by contrast, he had a 137 ERA+.  (An average ERA+ is 100, with a score over 100 indicating that a pitcher has performed better than the average, and a score below 100 pointing to below-average performance.) 

Lincecum's core stats -- strikeouts, walks, grounders -- suggest he deserves better than the middling 4.18 ERA that he carries into his Wednesday start against the Nationals as indicated by his fielding-independent ERA of 3.49 (FIP determines the quality of a pitcher's performance by eliminating plate appearance outcomes that involve defensive play. The basic pitcher-dependent outcomes are home runs, walks and strikeouts.). What's especially promising for Lincecum's 2014 free-agent prospects is how he has dramatically lowered his walk rate over the course of the season. 

Lincecum's declining walk rate

Lincecum issued a free pass to 13.2% of batters faced in April, well north of the 7.4% average for National League starting pitchers.

That walk rate has declined each month since then, however: 

  • 8.9% of batters faced in May
  • 7.9% in June
  • Just 6.6% in July-August. 

The Freak didn't suddenly start firing more pitches over the plate -- his percentage of pitches thrown within the strike zone has hovered around 50% most of the season, and is actually lower since the beginning of July (45%). Rather, Lincecum has induced more hitters to chase his stuff off the plate.

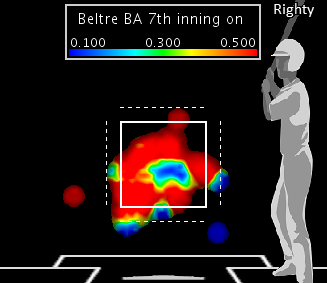
Check out his opponent chase rate by pitch location:

April

May

June

July-August

Lincecum got hitters to expand their strike zones just 21.4% of the time in April, a far cry from the 27% MLB average. His chase rate has steadily climbed since then: 24.6% in May, 25.9% in June, and 32% in July-August. With that, his batting average against has benefited dramatically because it's hard to get wood on pitches out of the zone. His BAA in May was .294, in June .263, in July .212, in August it's .140.

He's getting more chases with both his changeup and breaking stuff, and most of those wild swings are coming on pitches thrown at or below the knees.

In April, Lincecum had a 25.4% chase rate on pitches tossed to the lower third of the zone. That lower-third chase rate has soared: 26.8% in May, 35.3% in June, and 40.1% in July-August.

It remains to be seen as to whether his value in off-season will soar as well.

Wednesday
Aug072013

How do pitchers do on the first batter of the game?

We often hear about getting to a pitcher early, but I want to look at the earliest of the early and see how pitchers have fared on the very first batter they faced in the 1st inning.

Up first

  • Qualified starters are hit at a .253 pace by the leadoff batter in the 1st inning, batters have a .311 OBP, slug .393, for a .704 OPS.
  • Overall, qualified starters are hit at a .249 pace by all the batters they face, batters have a .307 OBP, slug .390, for a .697 OPS.

No surprises there. We expect the leadoff batter to do better than at least three and maybe four members of a representative lineup, so we expect them to be better in all statistical categories, but understandably, not by an enormous amount.

Who does well?

You won't find anyone better this season than Bronson Arroyo, who has faced 22 leadoff batters and retired them all, striking out five, getting eight grounders and nine outs in the air. Just to let you know, Arroyo has a 2.84 ERA in 1st inning and a .220 BAA.

Next up, is Jordan Zimmermann. Leadoff batters are 1-for-22 against Jordan with four whiffs for an .045 BAA. The one hit occurred in his last outing on August 2 when he allowed a leadoff double to Rickie Weeks and Zimm stranded him. Overall in his 1st innings, Zimmermann has a 1.64 ERA and a .163 BAA.

The third of four starters who have allowed one hit or less to the leadoff batter is Jeremy Guthrie. Guthrie has faced 23 leadoff batters, walked four and allowed just one hit, a Matt Carpenter double on May 30. The Cards got to  Guthrie for two runs that night in the 1st, but Guthrie held them scoreless over the next five innings.

The final first batter star pitcher is the Mets phee-nom Matt Harvey. Harvey has allowed one hit and one walk to the 22 batters he's faced (.048), while striking out seven. The one hit was a Juan Pierre bunt single on June 2. 

First batter of the game strikeout leaders
  PA K
John Lackey (BOS) 20 9
Wade Miley (ARI) 23 7
Ryan Dempster (BOS) 22 7
Matt Harvey (NYM) 22 7
Mat Latos (CIN) 23 7
Felix Hernandez (SEA) 24 7
Edwin Jackson (CHC) 22 7
Clayton Kershaw (LAD) 24 7
A. J. Griffin (OAK) 23 7
Ubaldo Jimenez (CLE) 22 6

And the not so good...

I find this list fascinating because there is such a mix of successful and not so successful pitchers.

1st inning Leadoff Batter Struggles
  PA H AVG BB
James Shields (KC) 24 10 .455 2
Eric Stults (SD) 23 10 .455 1
Andy Pettitte (NYY) 20 10 .526 1
Shelby Miller (STL) 21 9 .529 4
Mat Latos (CIN) 23 9 .409 1
Lance Lynn (STL) 23 9 .391 0
Kyle Lohse (MIL) 23 9 .409 1
Felix Hernandez (SEA) 24 9 .375 0
Bud Norris (BAL) 24 9 .391 0
Anibal Sanchez (DET) 19 9 .563 3

My particular annoyance

I hate it when pitchers walk the first batter of the game. It irks me. Consequently, these guys annoy me.

Leaders in Leadoff Walks (Ugh!)
  PA H BB AVG OBP
Tim Lincecum (SF) 22 6 5 .353 .500
Dillon Gee (NYM) 22 3 5 .176 .364
Stephen Strasburg (WSH) 23 2 4 .111 .304
Shelby Miller (STL) 21 9 4 .529 .619
Ricky Nolasco (LAD) 23 5 4 .263 .391
Jeremy Guthrie (KC) 23 1 4 .053 .217
Jeff Samardzija (CHC) 23 7 4 .368 .478

Finally, here are the seven starters who have allowed two homers to first batters they faced

1st inning leadoff gopher pitchers
  PA H HR AVG SLUG
Yu Darvish (TEX) 22 3 2 .158 .474
Kyle Kendrick (PHI) 23 4 2 .200 .600
Kevin Correia (MIN) 22 7 2 .368 .684
John Lackey (BOS) 20 5 2 .250 .550
Jeff Samardzija (CHC) 23 7 2 .368 .737
Gio Gonzalez (WSH) 23 7 2 .318 .682
CC Sabathia (NYY) 23 5 2 .238 .571

The best first inning leadoff batters

Here's a bonus for you:

Leadoff batters in the 1st inning
  PA AVG OBP SLUG OPS H HR BB K
Shin-Soo Choo (CIN) 98 .353 .439 .671 1.109 30 5 7 15
Nate McLouth (BAL) 85 .342 .388 .468 .857 27 1 5 7
Eric Young Jr. (NYM) 71 .328 .423 .410 .832 20 0 9 6
Starling Marte (PIT) 102 .319 .373 .500 .873 30 1 5 27
Jacoby Ellsbury (BOS) 106 .313 .358 .495 .853 31 2 5 14
Desmond Jennings (TB) 76 .290 .355 .435 .790 20 2 7 16
Matt Carpenter (STL) 87 .288 .345 .413 .757 23 1 7 10
Michael Bourn (CLE) 81 .286 .321 .416 .737 22 2 4 16
Brett Gardner (NYY) 101 .272 .337 .380 .717 25 0 8 19
Austin Jackson (DET) 79 .271 .354 .343 .697 19 0 9 12
Norichika Aoki (MIL) 91 .263 .352 .313 .664 21 0 10 6
Coco Crisp (OAK) 89 .250 .326 .413 .738 20 3 9 10
Alejandro De Aza (CWS) 105 .213 .295 .372 .668 20 4 11 19
Denard Span (WSH) 92 .200 .261 .271 .531 17 0 7 19
Alex Gordon (KC) 83 .200 .277 .267 .544 15 1 6 17


After all is said and done, the best part of the leadoff experience is that the game has started.

Sunday
Aug042013

July Stats from the Bill Chuck Files

In honor of the July 8 game in which the Mets beat the Giants 4-3 in 16 innings, the longest game in July, here are 16 stats for your dining consumption. 

  1. Tim Lincecum and Stephen Strasburg led the majors whiffing 44 in July but each were 1-3 on the month.
  2. The AL hit 380 homers, the NL hit 312 in July.
  3. Lucas Harrell walked 20 batters in 20.1 July IP.
  4. The Yankees hit 10 homers in July, the fewest in the AL. It was the Yanks fewest July homers since they hit eight in 1919.
  5. Greg Holland led the majors with 11 saves in July.
  6. There were 24 complete games in July with 12 in each league, seven by the Rays.
  7. In 13 scoreless innings in July, Tyler Clippard allowed two hits and held opponents to a .049 BAA.
  8. Blue Jays pitchers allowed 37 homers in July, the Marlins gave up just 11.
  9. Hiroki Kuroda made five starts in July. In 33 IP he allowed two runs (0.55 ERA).
  10. In July, with runners in scoring position, from the 7th inning on, the Braves hit .373, the Orioles hit .078.
  11. Before he was traded, Ian Kennedy threw 194 pitches for Arizona in July, the most in baseball.
  12. The Red Sox were hit by 15 pitches in July, the most in the majors.
  13. Derek Holland’s 30 swing and misses were the most in baseball in July.
  14. The Brewers led the majors with 35 steals in July; the Orioles had only two steals.
  15. Jerome Williams allowed 29 runs the most in July, he was followed by Josh Johnson and CC Sabathia with 27.
  16. In July, Adrian Beltre hit .516 (16-31) from the 7th inning on.


Page 1 2 3 4 5 ... 6 Next 3 Entries »