Baseball Betting Tips for Beginners
 Thursday, February 8, 2024

Are you ready to take your baseball betting skills to the next level? If you're a beginner looking to make informed bets and increase your chances of success, this discussion is just what you ... [Read more]
What Is Sports Analytics?
 Friday, October 13, 2023

Sports analytics is an ever-evolving field that uses data to measure athletic performance and optimize the success of sports teams. From on-field metrics to off-field analytics, you can use... [Read more]
Umpires Calling Balls and Strikes Better Than Ever Before
 Alec Dopp |
  Thursday, February 27, 2014 at 11:00AM
The art of calling balls and strikes has long been a topic up for discussion among baseball fans, and if the last century-plus has been any indication, it seems as though professional baseball will have a masked man behind home plate for the prospective future.
But with the advancement of complex technologies such as Baseball Betting Sites at Casimoose.ca and pitch f/x data, umpires’ jobs have never before come under more scrutiny from the general public. Websites such as ESPN and MLB.com allow fans to visit their websites — for free — and view live game casts in which pitches are tracked and calculated for maximum accuracy and transparency.
Most baseball television broadcasts utilize this, as well, giving an ever bigger segment of the market the ability to say, “What a terrible call! That wasn’t a strike (or ball)! Look at the strike zone box thing!” I’d bet my entire college-student life savings that each of us has said something along these lines at least once.
Yet while the duties of the home plate umpire have never been more transparent in the history of the game, these guys have actually become more efficient at calling balls and strikes in recent years.
League Average Umpire Stats since 2008 (Regular Season)
| Strk% | Zone% | OOZ Clstk% | CC% | |
| 2013 | 63.6 | 49.4 | 8.9 | 88 |
| 2012 | 63.5 | 48.9 | 9.5 | 87.1 |
| 2011 | 63.2 | 48.6 | 9.7 | 86.7 |
| 2010 | 62.8 | 48.2 | 10.1 | 86.4 |
| 2009 | 62.4 | 48.6 | 10.5 | 85.2 |
| 2008 | 62.5 | 48.6 | 11.1 | 84.4 |
Dating back to 2008, umpires have become progressively less inclined to give called strikes on pitches located out of the zone. In 2008, the league-average ump tagged 11.1% of pitches thrown out of the zone as strikes. Doug Eddings topped all umps in this respect that season, citing a wholesome 14.6% of all out-of-zone offerings as strikes — the highest single-season ‘OOZ’ called strike mark of any ump over the last six years.
The league average OOZ called strike mark dropped more than a half percent in 2009, and with it, the league average ump’s correct call rate (shown by CC% in the table) increased by about the same margin. This perpetuated progressively in the four seasons to follow to the point where the league average home plate umpire accrued a 88% correct call rate last season — highest of any season since our database’s umpire tracking info began in ’08.
These improvements have stretched into the postseason, too. During the 2008 postseason (including the Phillies-Rays World Series), the league average umpire accrued a correct-call rate of 84.6%, juxtaposed to 88.6% last season — mainly due to an out-of-zone called strike rate decrease of 2.1% over that span (11.1% OOZ ClStk% in ’08 versus 9.0% in ’13).
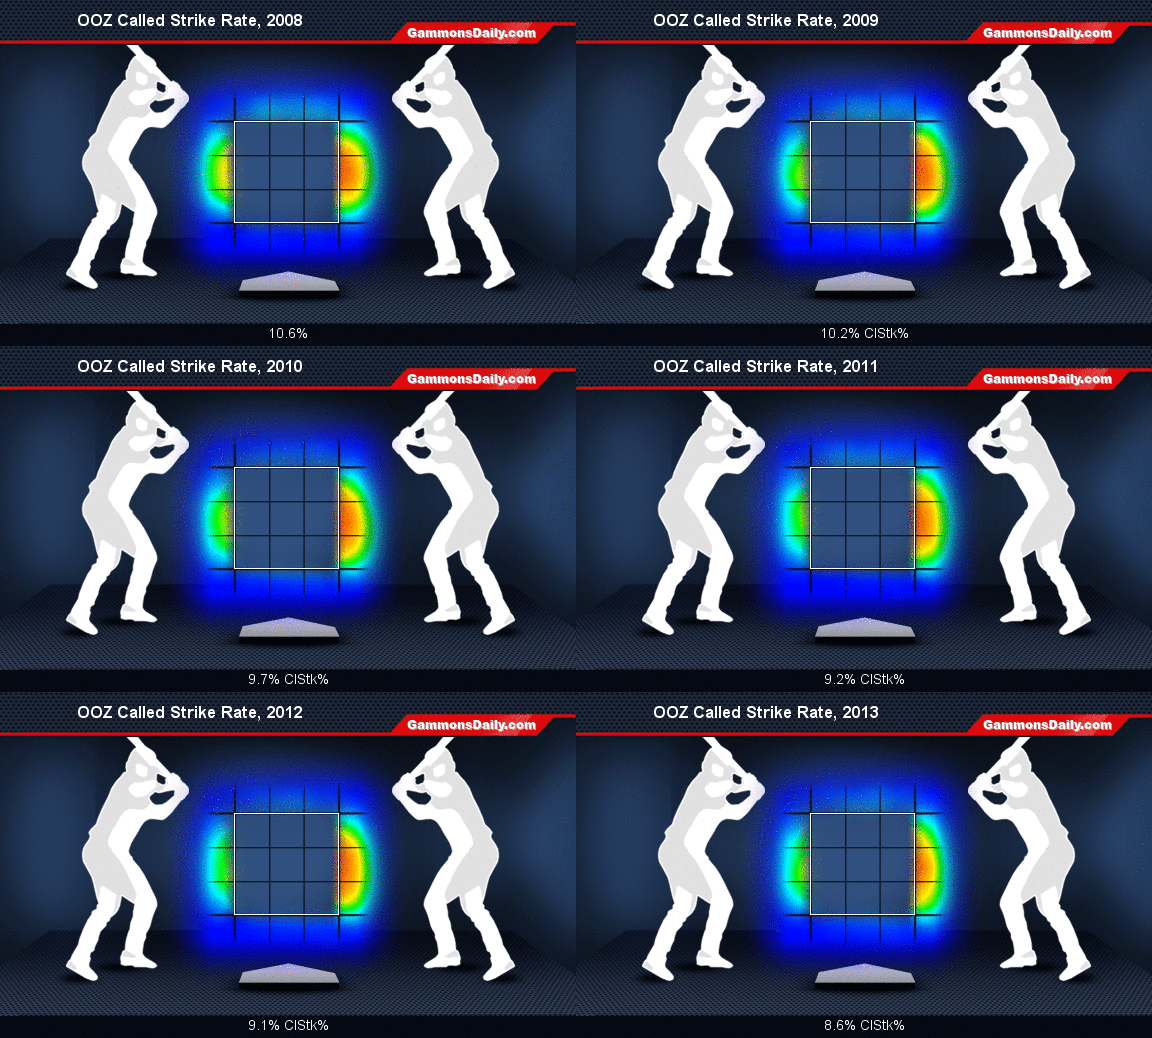
What do these decreasing OOZ called strike rates look like?
Comparing regular-season called strike rate heat maps since 2008

As we can see, the league average umpires’ strike zone has shrunken considerably over the past six seasons. Think that has an effect on a pitcher’s approach? You bet. Due to the lack of calls they’re receiving by umpires, pitchers are focusing in on throwing more ballsin the zone, which is evidenced by an increase in zone rate from 48.6% in 2008 to 49.4% last season and an increasing strike rate (strikes plus balls hit in play) from 62.5% in ’08 to 63.6%.
These increases may seem insignificant, but note that there is a strong correlation between zone rate and in play rate; the more pitches you throw in the zone, the more likely batters are to put those pitches in play.
Which batters and pitchers are most affected by umpires’ shriveling strike zone?
Both righty and lefty hurlers and batters have been affected, but some have been more so than others. Right-handed pitchers have witnessed a 1.5% OOZ called strike rate decrease since 2008 compared to the near identical 1.6% decline for southpaws.
Hitters’ zones have seen more fluctuation in this respect, however. Right-handed batters’ OOZ called strike rate has shrunk 2.0% since ’08 while lefties’ have cut back by 2.4 percent. As for batter-pitcher matchups, it seems that right-handed pitchers and left-handed batters have been most influenced, as umps have called OOZ called strikes 2.5% less since ’08 (2.3% decrease for RHP vs. RHB; 2.1% for LHP vs. LHP;1.4% for LHP vs. RHB).
With this in mind, it seems as though home plate umpires are getting unquestionably better at calling balls and strikes, even in an age where each pitch and subsequent call can be put into question not only in the regular season, but in the postseason, where umpires’ jobs are scrutinized even further. This has directly affected pitchers’ plan of attack against opposing batters, recognizing that stretching the outer and inner corners isn’t working as frequently as it once did.
Expanded replay and challenging rules this season will help the improve the game, especially .
But for balls and strikes?
Instant replay can wait. Umps have never been better.
 called strike rate,
  called strikes,
  umpires
