Search Archives
Contributors
  • Bill Chuck - Managing Editor
  • Dave Golebiewski
  • Daniel McCarthy
  • David Pinto
  • Jonathan Scippa
Follow Us

Featured Sponsors


What's New

Mailing List
Email Newsletter icon, E-mail Newsletter icon, Email List icon, E-mail List icon Sign up for our Email Newsletter
For Email Marketing you can trust
Twitter Feeds

This site utilizes the MLB analytics platform powered by TruMedia Networks

Entries in Miguel Cabrera (27)

Monday
Aug262013

Looking out for number three

When you are looking at the number three batter in most lineups, invariably you are looking at the best hitter on a player's team. 

Number three versus the clean-up batter in the lineup

There certainly have been times when the slugger in the number four slot was the man.

At least, that's what we grew up with fantasizing about.

I mean the number four guy in the line was the clean-up batter. He actually had a name because we pictured the first three guys getting on base and then the number four guy would clean up the bases with a big hit.

Isn't that why Lou Gehrig had so many grand slams?

But the reality is the number three batter has been the hitter to watch out for. Babe Ruth, Ted Williams, Willie Mays, and even Mickey Mantle were all primarily number three hitters.

Comparing number three and number four

Take a look at how the top 2013 team's number threes versus number four batters in the lineup have done.

Top 10 number three batters by team
  PA AVG OBP SLUG OPS HR BB K RBI
Detroit Tigers (DET) 606 .340 .431 .639 1.070 42 82 91 136
Pittsburgh Pirates (PIT) 575 .315 .395 .509 .904 19 62 86 75
Cincinnati Reds (CIN) 598 .314 .430 .504 .934 20 100 115 62
Kansas City Royals (KC) 565 .300 .366 .443 .809 16 52 72 77
San Francisco Giants (SF) 575 .296 .339 .458 .796 17 33 70 82
Colorado Rockies (COL) 584 .295 .363 .560 .923 32 56 148 83
Boston Red Sox (BOS) 605 .295 .370 .408 .778 8 63 66 71
New York Yankees (NYY) 563 .289 .361 .472 .832 23 53 89 83
New York Mets (NYM) 573 .288 .361 .472 .833 19 55 99 63
Cleveland Indians (CLE) 578 .288 .362 .475 .837 16 59 123 83
2013 Cleanup batters by team
  PA AVG OBP SLUG OPS HR BB K RBI
Colorado Rockies (COL) 570 .334 .391 .557 .948 26 48 104 106
Texas Rangers (TEX) 559 .328 .379 .544 .923 28 39 59 76
Los Angeles Dodgers (LAD) 560 .321 .382 .498 .880 16 47 103 78
St. Louis Cardinals (STL) 568 .320 .382 .482 .864 16 46 98 94
Boston Red Sox (BOS) 592 .313 .380 .574 .954 30 60 99 104
Washington Nationals (WSH) 552 .296 .377 .494 .871 22 62 114 83
Tampa Bay Rays (TB) 559 .295 .367 .497 .864 21 59 117 74
Baltimore Orioles (BAL) 555 .294 .328 .538 .866 32 23 111 107
San Francisco Giants (SF) 561 .278 .351 .451 .802 16 54 81 70
Atlanta Braves (ATL) 563 .278 .350 .460 .810 21 52 115 94

Look at the variance in the number three slot

Baseball's number three batters are interesting lot.

Baseball's #3 Batters - min. 300 PA
  PA AVG OBP SLUG K% BB% HR BB RBI Swng% Chas% P/PA
Miguel Cabrera (DET) 550 .358 .449 .684 14.5% 13.6% 42 75 128 50.4% 28.8% 3.69
Andrew McCutchen (PIT) 537 .318 .399 .509 14.7% 11.2% 17 60 71 46.2% 22.3% 3.77
Joey Votto (CIN) 585 .314 .432 .507 19.1% 17.1% 20 100 61 38.9% 16.7% 4.13
Robinson Cano (NYY) 355 .314 .389 .495 13.5% 11.0% 13 39 52 46.2% 28.7% 3.78
David Wright (NYM) 456 .308 .393 .514 16.2% 11.4% 16 52 53 45.1% 20.9% 3.78
Carlos Gonzalez (COL) 417 .299 .367 .591 26.9% 9.6% 25 40 67 48.2% 32.9% 3.89
Dustin Pedroia (BOS) 593 .299 .374 .415 11.0% 10.6% 8 63 71 42.4% 24.4% 4.12
Paul Goldschmidt (ARI) 501 .292 .394 .542 19.8% 14.2% 28 71 88 40.5% 20.4% 4.17
Jason Kipnis (CLE) 303 .283 .372 .445 21.1% 12.9% 7 39 44 39.1% 17.8% 4.31
Alex Rios (CWS) 460 .279 .329 .425 16.5% 6.7% 12 31 55 43.8% 24.7% 3.73
Adrian Gonzalez (LAD) 422 .277 .322 .446 14.7% 6.6% 15 28 60 51.5% 33.6% 3.66
Jason Castro (HOU) 323 .271 .341 .455 26.6% 9.3% 10 30 32 45.6% 27.4% 4.03
Nick Markakis (BAL) 383 .263 .326 .370 8.6% 8.4% 8 32 30 42.1% 24.5% 3.74
Matt Holliday (STL) 400 .263 .343 .455 15.3% 9.8% 15 39 55 50.9% 27.7% 3.70
Albert Pujols (LAA) 443 .258 .330 .437 12.4% 9.0% 17 40 64 45.8% 29.8% 3.79
Justin Upton (ATL) 396 .255 .347 .455 25.3% 11.9% 16 47 46 44.8% 21.6% 4.07
Giancarlo Stanton (MIA) 372 .251 .363 .470 26.3% 14.5% 16 54 40 41.4% 26.7% 4.18
Chase Headley (SD) 371 .225 .329 .356 25.1% 11.3% 7 42 30 44.9% 24.4% 3.94
Anthony Rizzo (CHC) 438 .220 .313 .420 19.6% 11.2% 16 49 56 44.5% 26.5% 3.92

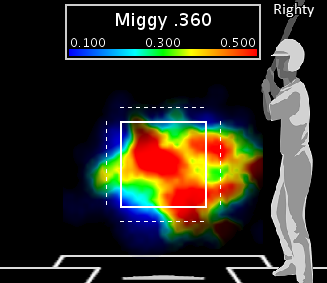
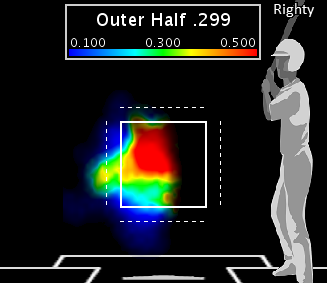
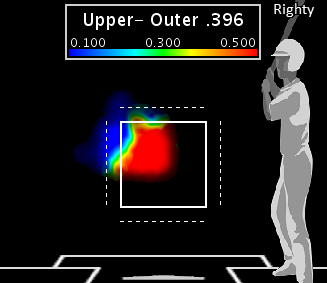
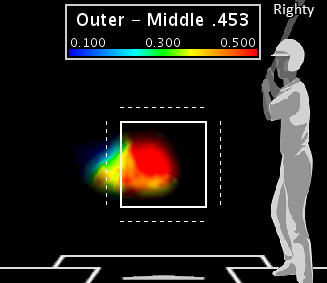
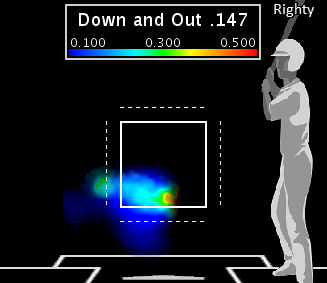
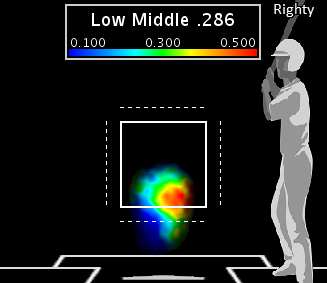
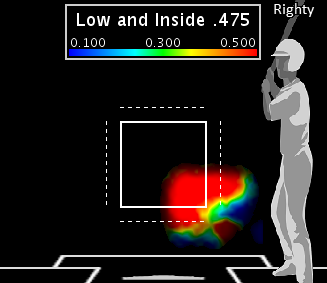
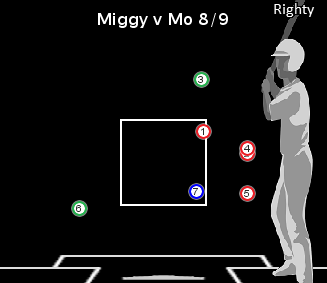
When you look at Miguel Cabrera, you see not the just best number three in baseball, you are looking at the best hitter in the game, on his way to historical greatness.

Andrew McCutchen potentially is on his way to being the NL MVP.

Joey Votto is a great player, but he is the reason why this chart includes walks, swing percentage, and chase percentage. There are many folks out there who get frustrated with Joey's selectivity and when you compare him to his peers, you can see why.

Robinson Cano, is the present and immediate future for the Yankees, if they can retain him. These numbers show you why Jay Z is feeling good about his client.

There is a reason why David Wright is called Captain America, and it's not just because of his good looks. He has good numbers in the three slot.

Carlos Gonzalez is a lifetime .300 hitter.

Dustin Pedroia is the anomaly on this list. The again, when you look at baseball's great players, Pedey is an anomaly in almost every respect.

Paul Goldschmidt is another NL MVP candidate as is Adrian Gonzalez.

Then you have the rest of Gilligan's Island in this select group.

The moral of the story

The moral of this story is very simple:

"If you are a pitcher, be less involved about thinking about number one...you're better off when you focus on number three."

Wednesday
Aug212013

Batters: First Pitch of an At Bat

Entering play on Thursday, there had been 73,352 plate appearances and 282,213 pitches seen.

That averages 3.847 pitches per plate appearance.

Some batters see nine or 10 pitches in a plate appearances, some see only two. But the one thing we know, is that every time someone steps up to the plate, the batter sees at least one pitch.

That makes the first pitch of an at bat a pretty interesting variable. Not always statistically significant, but certainly interesting and really kind of fun.

Who swings?

Top 20 batters who swing at the first pitch
  P Swng#
Carlos Gomez (MIL) 463 240
Miguel Cabrera (DET) 528 227
Freddie Freeman (ATL) 484 223
Josh Hamilton (LAA) 505 212
Adam Jones (BAL) 542 205
Ian Desmond (WSH) 510 198
Pablo Sandoval (SF) 448 195
Alexei Ramirez (CWS) 534 193
Chris Davis (BAL) 521 189
Jay Bruce (CIN) 542 186
Yadier Molina (STL) 413 185
Justin Morneau (MIN) 509 185
Mark Trumbo (LAA) 534 181
Hunter Pence (SF) 529 181
Andrew McCutchen (PIT) 525 181
Robinson Cano (NYY) 540 178
Anthony Rizzo (CHC) 532 178
Jose Altuve (HOU) 514 177
Marlon Byrd (NYM) 443 174
Matt Holliday (STL) 460 173

Who gets hits?

Top 20 batters who get hits on the first pitch
  H 2B 3B HR
Miguel Cabrera (DET) 39 3 0 13
Robinson Cano (NYY) 36 5 0 7
Freddie Freeman (ATL) 36 8 1 4
Carlos Gomez (MIL) 34 8 2 6
Adam Jones (BAL) 32 6 1 8
Anthony Rizzo (CHC) 31 9 1 7
Kendrys Morales (SEA) 30 6 0 6
Yasiel Puig (LAD) 29 5 1 5
Yadier Molina (STL) 29 9 0 2
Joey Votto (CIN) 29 5 1 5
Alexei Ramirez (CWS) 28 7 0 0
David Wright (NYM) 27 2 1 4
Andrew McCutchen (PIT) 27 9 1 1
Alcides Escobar (KC) 27 6 0 2
A. J. Pierzynski (TEX) 27 4 0 5
Yunel Escobar (TB) 26 5 0 3
Mark Trumbo (LAA) 26 2 0 8
Ian Desmond (WSH) 26 5 0 1
Hunter Pence (SF) 26 4 1 2
Gerardo Parra (ARI) 26 5 0 2

Who hits homers?

Who hits homers on the first pitch?
  AB HR
Miguel Cabrera (DET) 80 13
Chris Davis (BAL) 54 10
Edwin Encarnacion (TOR) 56 9
Pedro Alvarez (PIT) 48 8
Mark Trumbo (LAA) 67 8
Evan Longoria (TB) 44 8
Adam Jones (BAL) 79 8
Robinson Cano (NYY) 87 7
Anthony Rizzo (CHC) 79 7
Troy Tulowitzki (COL) 46 6
Kendrys Morales (SEA) 61 6
Josh Hamilton (LAA) 72 6
Jose Bautista (TOR) 37 6
Hanley Ramirez (LAD) 40 6
Chris Carter (HOU) 28 6
Carlos Gomez (MIL) 87 6
Bryce Harper (WSH) 49 6

Who misses?

Who swings and misses first pitches?
  Swng# Miss# Miss%
Carlos Gomez (MIL) 240 65 27.1%
Josh Hamilton (LAA) 212 63 29.7%
Jay Bruce (CIN) 186 62 33.3%
Mark Trumbo (LAA) 181 61 33.7%
Ian Desmond (WSH) 198 61 30.8%
Freddie Freeman (ATL) 223 61 27.4%
Chris Davis (BAL) 189 61 32.3%
Pedro Alvarez (PIT) 156 59 37.8%
Adam Jones (BAL) 205 56 27.3%
Marlon Byrd (NYM) 174 55 31.6%
Dan Uggla (ATL) 154 54 35.1%
Miguel Cabrera (DET) 227 53 23.3%
Todd Frazier (CIN) 165 50 30.3%
Justin Upton (ATL) 149 50 33.6%
John Buck (NYM) 167 50 29.9%

Who takes strikes?

Who takes called strikes on first pitches?
  P Strk# ClStk# ClStk%
Dustin Pedroia (BOS) 577 335 278 53.5%
Matt Carpenter (STL) 549 334 266 55.3%
J. J. Hardy (BAL) 496 301 250 56.2%
Martin Prado (ARI) 521 305 248 53.4%
Alex Rios (TEX) 508 298 228 52.1%
Starling Marte (PIT) 536 363 225 56.5%
Mike Trout (LAA) 560 297 224 46.0%
Marco Scutaro (SF) 472 277 223 53.3%
Alejandro De Aza (CWS) 539 327 221 51.0%
Brian Dozier (MIN) 464 268 217 52.5%
Jose Bautista (TOR) 528 311 216 49.9%
Nick Markakis (BAL) 556 315 210 46.6%
Ian Kinsler (TEX) 447 253 209 51.9%
Jason Kipnis (CLE) 512 273 208 46.5%
Ryan Zimmerman (WSH) 471 273 203 50.6%
Carlos Santana (CLE) 490 283 203 49.5%
Nate McLouth (BAL) 470 296 202 53.7%
Alex Gordon (KC) 532 306 201 47.1%
Starlin Castro (CHC) 538 312 200 46.9%
Allen Craig (STL) 509 307 200 49.8%

Who Takes?

Who takes first pitches?
  P Strk# Zone# Ball#
Dustin Pedroia (BOS) 520 278 293 242
Mike Trout (LAA) 487 224 240 263
Matt Carpenter (STL) 481 266 244 215
Joe Mauer (MIN) 469 232 211 237
Martin Prado (ARI) 464 248 260 216
Nick Markakis (BAL) 451 210 197 241
Jason Kipnis (CLE) 447 208 194 239
J. J. Hardy (BAL) 445 250 269 195
Alex Rios (TEX) 438 228 232 210
Jose Bautista (TOR) 433 216 212 217
Alejandro De Aza (CWS) 433 221 204 212
Jacoby Ellsbury (BOS) 430 193 193 237
Elvis Andrus (TEX) 430 198 219 232
Paul Goldschmidt (ARI) 428 188 194 240
Evan Longoria (TB) 427 190 213 237
Alex Gordon (KC) 427 201 183 226
Starlin Castro (CHC) 426 200 216 226
Brett Gardner (NYY) 424 198 186 226
Kyle Seager (SEA) 421 196 174 225
Billy Butler (KC) 421 191 199 230

I told you it was fun

Spend a little time mulling this over and leave some comments. I look forward to hearing from you.

Monday
Aug192013

How to get Miguel Cabrera out (it's not that easy)

I am in awe of living in the Miguel Cabrera Era.

I feel like every day I'm writing another edition of The Miguel Cabrera Report describing the accomplishments and exploits of the right-handed bat of this generation.

Check out the numbers for the last two seasons

The Miggy Report
  AVG SLUG OBP HR RBI Runs G AB
Miguel Cabrera 2013 .360 .689 .452 40 120 89 116 444
Miguel Cabrera 2012 .330 .606 .393 44 139 109 161 622
Miguel Cabrera 2012-13 .342 .641 .418 84 259 198 277 1066

How to get Miguel Cabrera out

I thought you might interested in knowing that there are some ways of getting Miggy out, but the margin between a pitcher's success and failure is mighty slim.

All the graphics represent Miguel Cabrera BA for 2013

Here is a look at Cabrera's 522 PA in 2013

Clearly, we can see that Cabrera owns the inner half of the plate where he's hitting .404.

So if a pitcher wants to get Cabrera out, he's got to go to the outside.

Cabrera on the outer half

Cabrera is hitting .299 on the outer half of the plate, a number that a pitcher would not consider manageable particularly when you consider he's hit 15 homers and has a 1.037 OPS out there.

How about the upper half of the outer half of the plate?

Is this how to get Miggy out?

If I were a pitcher, I wouldn't want to go to there.

In that quadrant, Cabrera is hitting .396 and he has an OPS of 1.301.

How about the middle of the outer half?

OMG! This is not where you want to pitch Cabrera.

Miggy is hitting .453 with 12 homers and an OPS of 1.425.

That leaves only one spot

This is indeed the magic spot.

Cabrera proves that he is human when you can throw him pitches low and outside where he is only hitting .147 with an OPS of .580.

But you must be precise

A pitcher has to really be precise because if you miss the corner and you pitch low, but you end up in the middle of the plate, Miggy starts to recover.

A .286 BA is mortal, the .866 OPS is getting scary though.

But don't miss low and inside

Miggy punishes pitchers at a .475 rate and a 1.198 OPS. But he's been held to just one homer.

Here's the one homer

On August 9, Cabrera made a remarkable adjustment against Mariano Rivera and pitch number seven from Mo was an enormous game-tying homer.

Good luck to pitchers

So there's your lesson in how to get Miggy Cabrera out.

Remember, we are talking inches here.

If you are off by just a couple of inches, the Marvelous Miguel will punish you and even if you are not, as Mo learned, if he makes an adjustment your best laid plans will head toward the stands.


Page 1 2 3 4 5 ... 9 Next 3 Entries »