Search Archives
Contributors
  • Bill Chuck - Managing Editor
  • Dave Golebiewski
  • Daniel McCarthy
  • David Pinto
  • Jonathan Scippa
Follow Us

Analytics Posts
  • Baseball Analytics Blog RSS
Featured Sponsors


What's New

Mailing List
Email Newsletter icon, E-mail Newsletter icon, Email List icon, E-mail List icon Sign up for our Email Newsletter
For Email Marketing you can trust
Twitter Feeds

This site utilizes the MLB analytics platform powered by TruMedia Networks

Entries in Detroit Tigers (63)

Tuesday
Dec032013

Fister Takes Impeccable Command to D.C. 

Judging from the trade package the Tigers received from the Nationals in exchange for Doug Fister, you might think he's just some back-of-the-rotation schlub. Instead, it appears that Washington GM Mike Rizzo just landed one of the game's best starters, still two years away from free agency, for a good-not-great pitching prospect (Robbie Ray), a potential lefty specialist (Ian Krol), and a versatile bench bat (Steve Lombardozzi).

Fister doesn't look like an ace, lobbing 89 MPH fastballs and a cornucopia of breaking and offspeed stuff toward home plate. But don't mistake a lack of velocity for a lack of talent. Over the past three seasons, Fister ranks eighth among all starting pitchers in Baseball Reference Wins Above Replacement (12.6), and his park-and-league-adjusted ERA (24 percent above average) places tenth. Fister bested now former teammate and newly crowned AL Cy Young Award winner Max Scherzer in both categories.

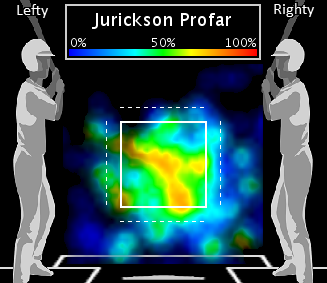
The 29-year-old righty produces elite results with pedestrian stuff thanks to a nearly unparalleled ability to throw strikes. Fister has issued a mere 1.8 walks per nine innings pitched since 2011, tying him with new rotation mate Jordan Zimmermann for seventh among starters tossing at least 500 frames over that time frame. He doesn't just flood the strike zone, though -- he avoids the fat part of the plate like few others. Take a look at Fister's pitch location over the past three seasons:

Fister's pitch location, 2011-2013


From 2011-13, MLB starters threw an average of 23.6 percent of their pitches to the horizontal middle of the strike zone. Fister, by contrast, threw just 20.8 percent of his pitches down the middle. Among AL starters throwing at least 6,000 pitches since 2011, only Mark Buehrle (20.3 percent) and Jon Lester (20.7) offered hitters fewer cookies.

Why does that matter? Pitches thrown over the middle of the plate get hammered, with hitters slugging a collective .484 against those offerings from 2011-13. Pitchers fare far better when they bust hitters inside (.412 slugging percentage) or paint the outside corner (.330).

The Mariners might be absolved for not fully appreciating Fister's then-burgeoning talents, shipping him to Detroit for a gaggle of so-so-prospects during a 2011 season in which the club lost 95 games. But the Tigers, still equipped to make a World Series run with Justin Verlander, Scherzer, Anibal Sanchez and an in-his-prime Miguel Cabrera, get no such benefit of the doubt. While Drew Smyly appears ready for a rotation spot, Detroit surrendered one of the game's top arms, making far less than he would garner on the open market, for three none-elite youngsters. Fister might be a soft tosser, but his superb command makes him every bit as valuable as more heralded fire ballers.

Tuesday
Nov262013

To Justify Prospect Hype, Profar Must Solve Breaking Stuff 

The Ian Kinsler-Prince Fielder mega deal clears the way for Jurickson Profar to take over the keystone spot in Texas. The switch-hitter from Curacao, still a few months shy of his 21st birthday, ranked as the top prospect in the game according to both Baseball America and MLB.com prior to the 2013 season, showcasing plate discipline (a career .367 on-base percentage in the minors) and power (.449 slugging percentage) beyond his years at a premium position on the diamond.

Profar's tools and polish didn't immediately translate to the majors, however. The trendy preseason pick for American League Rookie of the Year posted a park-and-league-adjusted OPS that was 24 percent below average, ranking 20th out of 24 newcomers logging at least 300 plate appearances. Profar's struggles against curveballs and sliders are a major reason why he was outhit by fellow rookie middle infielders like Brad Miller, Jose Iglesias, Anthony Rendon, Nick Franklin and Didi Gregoroius. To start doing damage versus breaking stuff, the uber-patient Profar will first have to take the bat off his shoulder.

Profar did an excellent job of taking curves and sliders thrown outside of the strike zone, chasing those pitches less than half as often (14.3 percent) as the major league average (30.8 percent). Unfortunately, his "just looking, thanks" approach extended to breaking balls thrown over the heart of the plate.

Profar's swing rate by pitch location vs. curveballs and sliders, 2013

He swung at a mere 54.3 percent of curves and sliders thrown within the strike zone, well below the 61.6 percent major league average. Profar was particularly gun-shy when a pitcher missed his target: He swung at 47.4 percent of breaking stuff thrown to the middle of the plate. Typically, pitchers pay the price when they throw belt-high curveballs and sliders (hitters slugged a collective .459 last year). Against Profar, however, those mistakes still produced strikes.

By taking juicy curves and sliders so often, Profar rarely made loud contact when he did decide to swing. He slugged just .256 versus breaking pitches, nearly 80 points below the MLB average, and hit a grounder 68.2 percent of the time he put the ball in play.

Despite Profar's rough introduction to the big leagues, Rangers fans shouldn't despair. Other young middle infielders eventually became stars after flailing at the plate as rookies, including Hall of Famer Robin Yount (79 OPS+ as a teenager in 1974), Gary Sheffield (82 OPS+ at age 20 in 1989) and Alan Trammell (89 OPS+ as a 20-year-old in 1978). And, like Trammell, Profar has the defensive chops to play an up-the-middle position throughout his career (he'd be a standout at shortstop if not for the presence of Elvis Andrus).

Many rookies must learn to tone down their plate approach, limiting overzealous swings at junk pitches thrown in the dirt. But in Profar's case, he needs to be more aggressive. When pitchers hang a breaking ball over the middle of the dish, he has to make them pay.

Monday
Oct142013

Two Games of LCS Pitching

The pitching in these League Championship Series has been remarkable and worth taking a deeper look.
2013 LCS pitching through two games
IP PA P/PA AB H XBH HR BB K AVG BABIP WHAV ERA WHIP
1. St. Louis Cardinals 22.0 85 4.09 76 14 3 0 7 24 .184 .269 .026 0.82 0.955
2. Los Angeles Dodgers 20.1 74 3.89 67 9 3 0 6 18 .134 .180 .000 1.33 0.738
3. Detroit Tigers 17.0 69 4.43 59 8 3 1 9 32 .136 .269 .017 2.65 1.000
4. Boston Red Sox 18.0 78 3.65 70 17 8 2 5 13 .243 .273 .072 3.00 1.222

Two broad strokes:
  • The Dodgers are one unlucky team, but the Cardinals are also pitching brilliantly.
  • The most significant number that might explain why Boston is tied in their LCS can be seen as they continue to do what they do best: work the pitcher. Their 4.43 pitches per plate appearance is significantly greater than any of the other three teams.

Let's go deeper by looking at the starting pitching

Clearly the Cardinals and Dodgers starters have been outstanding, but the Tigers starters have been even better. As we progress in this postseason, it would be fair to say that the Red Sox starters are the weakest of the four teams and the team's greatest weakness.
2013 LCS Starting pitching through two games
IP PA P/PA AB H XBH HR BB K AVG BABIP WHAV ERA WHIP
1. Detroit Tigers 13.0 50 4.48 41 2 1 0 8 25 .049 .125 .000 0.69 0.769
2. Los Angeles Dodgers 14.0 48 3.67 45 6 3 0 2 15 .133 .194 .000 1.29 0.571
3. St. Louis Cardinals 12.1 53 3.91 49 11 2 0 3 13 .224 .306 .041 1.42 1.105
4. Boston Red Sox 12.0 53 3.60 49 14 6 2 1 10 .286 .324 .083 4.50 1.250
2013 LCS Starters through two games
IP PA P/PA AB H XBH HR BB K AVG BABIP WHAV ERA WHIP
1. Anibal Sanchez (DET) 6.0 25 4.64 19 0 0 0 6 12 .000 .000 .000 0.00 1.000
2. Clayton Kershaw (LAD) 6.0 20 3.60 18 2 2 0 1 5 .111 .143 .000 0.00 0.500
3. Michael Wacha (STL) 6.1 26 4.31 25 5 1 0 1 8 .200 .294 .080 0.00 0.900
4. Max Scherzer (DET) 7.0 25 4.32 22 2 1 0 2 13 .091 .222 .000 1.29 0.571
5. Jon Lester (BOS) 6.0 27 4.04 24 6 1 0 1 4 .250 .300 .125 1.42 1.105
6. Zack Greinke (LAD) 8.0 28 3.71 27 4 1 0 1 10 .148 .235 .000 2.25 0.625
7. Joe Kelly (STL) 6.0 27 3.52 24 6 1 0 2 5 .250 .316 .000 3.00 1.333
8. Clay Buchholz (BOS) 5.1 26 3.15 25 8 5 2 0 6 .320 .353 .042 7.94 1.412

Let's go even deeper by looking at the bullpens

Tigers fans instead of bemoaning the fact that you are leaving Boston tied 1-1, you need to feel really happy you got out of Dodge with a win. The Red Sox have lit up the Detroit bullpen, barely escaping with a win in Game 1 and you saw what happened in Game 2.
2013 LCS Bullpen pitching through two games
IP PA P/PA AB H XBH HR BB K AVG BABIP WHAV ERA WHIP
1. Boston Red Sox 6.0 25 3.76 21 3 2 0 4 3 .143 .167 .048 0.00 1.167
2. St. Louis Cardinals 9.1 32 4.41 27 3 1 0 4 11 .111 .188 .000 0.00 0.750
3. Los Angeles Dodgers 6.0 26 4.31 22 3 0 0 4 3 .136 .158 .000 1.42 1.105
4. Detroit Tigers 4.0 19 4.32 18 6 2 1 1 7 .333 .500 .056 9.00 1.750
 

It's not just one Tigers reliever, it's all of them

You have to wonder if Jim Leyland is going to have the phone removed from the dugout
2013 LCS Tigers relief pitching through two games
IP PA P/PA AB H XBH HR BB K AVG BABIP WHAV ERA WHIP
1. Al Alburquerque 1.1 5 4.00 5 1 0 0 0 3 .200 .500 .000 6.75 0.750
2. Joaquin Benoit 1.1 6 5.00 6 2 1 1 0 2 .333 .333 .000 6.75 1.500
3. Jose Veras 1.0 4 2.50 4 1 1 0 0 2 .250 .500 .000 9.00 1.000
4. Drew Smyly 0.1 2 6.50 1 0 0 0 1 0 .000 .000 .000 27.00 3.000
5. Rick Porcello 0.0 2 4.50 2 2 0 0 0 0 1.000 1.000 .500 - -
Page 1 2 3 4 5 ... 21 Next 3 Entries »