Search Archives
Contributors
  • Bill Chuck - Managing Editor
  • Dave Golebiewski
  • Daniel McCarthy
  • David Pinto
  • Jonathan Scippa
Follow Us

Analytics Posts
  • Baseball Analytics Blog RSS
Featured Sponsors


What's New

Mailing List
Email Newsletter icon, E-mail Newsletter icon, Email List icon, E-mail List icon Sign up for our Email Newsletter
For Email Marketing you can trust
Twitter Feeds

This site utilizes the MLB analytics platform powered by TruMedia Networks

Entries in curveball (10)

Monday
Jan202014

Clayton Kershaw's $215 Million Curveball

There are myriad reasons why Dodgers lefty Clayton Kershaw just earned a seven-year, $215 million contract extension, becoming the first player in history to pull in more than $30 million a season. Kershaw, 26 in March, boasts the fifth-best park-and-league-adjusted ERA (46 percent above average) ever for a starting pitcher during his first six seasons in the majors, trailing only Walter Johnson (164 ERA+), Mordecai Brown (158 ERA+), Smoky Joe Wood (152 ERA+) and Christy Mathewson (150 ERA+). He's a workhorse, having topped 200 innings pitched in each of the past four seasons, and he has fooled hitters like no other lefty (9.2 strikeouts per nine frames) this side of Randy Johnson (9.4 K/9) to start his career.

Yet for all of the breathtaking stats that Kershaw has compiled since making his debut at Chavez Ravine back in May of 2008, this one may be the most remarkable: he has thrown a total of 2,155 curveballs during the regular season, according to our Pitch F/X data, and exactly zero of those hooks have landed in the cheap seats. That's right -- Kershaw has never surrendered a regular-season homer on the pitch that earns him comparisons to Sandy Koufax. Batters have launched 1,945 home runs off curveballs dating back to '08, but nobody has gone deep against Public Enemy Number One.

What in the name of Vin Scully is going on here? How has Kershaw been so thoroughly dominant with his curveball, which has smothered hitters to the tune of a major league low .145 opponent slugging percentage from 2008-13? Here are three reasons why Kershaw's curve seemingly can't be taken deep.

Batters can't tell whether it's a ball or a strike -- or just don't think they can hit it

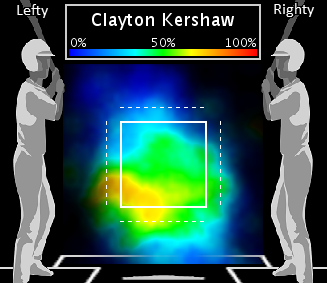
To go deep, you obviously have to swing the bat -- and opponents rarely do when Kershaw unleashes a curve. Batters have swung at just one-third of curveballs seen from Kershaw since '08, compared to the 40 percent major league average. Even when the pitch ends up being thrown in the strike zone, hitters pull the trigger less than half of the time (47 percent, compared to the 55 percent MLB average). Either batters can't discern whether it's over the plate in time to swing, or they figure it's futile to even try.

Hitters' swing rate by pitch location versus Kershaw's curveball, 2008-13
Kershaw's curve induces weak contact

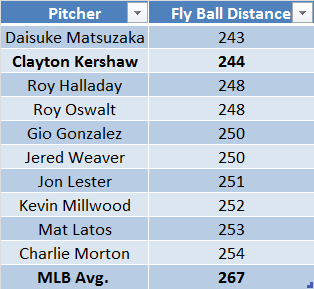
When hitters do swing at Kershaw's curve, they often just pound the pitch into the infield grass or hit a weak fly ball. Kershaw has generated grounders 55.2 percent of the time that batters have put his curve in play, north of the 52 percent MLB average. Those who manage to loft the pitch into the air have won a moral victory, but little else. Batters have hit fly balls off Kershaw's curve an average of 244 feet -- second-lowest among all qualified starters dating back to 2008.

Lowest Average fly ball distance on curve balls put in play, 2008-2013 (min. 800 curveballs thrown)  
Kershaw can add and subtract with his curve

L.A.'s ace has thrown his curveball at an average of 73.4 MPH during his career. But he can dial it way up (topping 82 MPH on the gun) or way, way down (he threw a 49 MPH yakker to Yasmani Grandal on September 9, 2012 -- Grandal didn't swing, of course). That might be part of the reason why hitters so rarely swing at Kershaw's curve -- it could be a power pitch, or it might arrive at home plate slower than a Prius traveling on Interstate 5.

Kershaw was wild with curveball when he first arrived in the bigs, throwing it for a strike less than half of the time, but he has gradually learned to control the pitch (57 percent strike rate last year) while adding precision to his power arsenal. His curve, like the rest of his game, has only gotten better. That's a scary proposition any hitter dreaming of finally going yard off the pitch.

Friday
Nov082013

Newly-Extended Perez Must Improve Breaking Stuff to Take Next Step

The Texas Rangers have locked up yet another young left-handed starter, signing Martin Perez to a four-year, $12.5 million extension with three club options that could extend Perez's stay in the Lone Star State to 2020 and pad his pockets to the tune of $32.5 million.

A perennial top prospect, Perez erased memories of his rough big league stint in 2012 by posting a park-and-league-adjusted ERA that was 14 percent above average (114 ERA+). The 22-year-old enjoyed arguably the best rookie season ever for a Texas lefty, as only Mike Mason (114 ERA+ in 1984) matched him while throwing 120+ innings. Perez displayed sharp control (2.7 walks per nine innings) and racked up ground balls (47.9 percent of pitches put in play), both of which bode well for his future. But he also punched out just 6.1 batters per nine frames, far below the 7.2 average for starting pitchers in this strikeout-saturated era. To get more swings and misses, Perez will have to improve his pitch location with his breaking stuff.

Perez already has an out pitch in his changeup, which generated far more whiffs (39.7% of the time batters swing) than the league average (29.4%) and limited hard contact (.307 opponent slugging percentage, 90 points below the MLB average). His curveball and slider, on the other hand, induced swings and misses just 19% of the time (29.9% average for breaking pitches) and were frequently laced into the gaps (.437 slugging percentage, 92 points above the MLB average).

Why did hitters square up Perez's breaking pitches? The young lefty struggled to command his slider and curve, too often leaving breaking balls over the heart of the plate:

Perez's pitch location with his slider and curveball, 2013

Perez threw 29% of his sliders and curves to the vertical middle of the strike zone, third-highest among lefty starting pitchers in 2013. Belt-high breaking stuff tends to get clobbered, with hitters swinging through just 12.9% of sliders and curves thrown over the middle of the plate and slugging a collective .461. Perez was no exception, getting whiffs 13.8% of the time and allowing a .556 slugging percentage when tossing a belt-high breaking pitch.

The recent history of low-strikeout lefties who nonetheless posted quality ERAs during their rookie season is mixed. On the wildly positive side, Andy Pettitte pitched into his forties and cobbled together a career that may get him some Cooperstown consideration. However, the list of low-K lefties (six or fewer strikeouts per nine) with an ERA similiar to Perez (10-20 percent better than the league average) also includes the likes of Gustavo Chacin, John Lannan and John Halama. To be more like Pettitte and less like Halama, Perez needs to complement his knockout changeup with better-located breaking pitches.

Thursday
Sep122013

Cole Putting Hitters Away with Slider, Curve in 2nd Half

Will Gerrit Cole be a starter or reliever come October? Pirates General Manager Neal Huntington isn't tipping his hand as the first overall pick in the 2011 draft nears an unknown organizational innings limit. Whatever his role, Cole looks primed to make make an impact in the playoffs. The rookie has boosted his strikeout rate during the season's second half (from 5.4 per nine innings pitched to 7.9 K/9) and trimmed his ERA from 3.89 to 3.18.

Cole fell in love with his fastball early on during his big league career, but he's pitching more like the ace he's expected to become now that he's mixing in his breaking stuff.

During the first half, Cole threw his fastball about 77% of the time -- more often than any starting pitcher not named Bartolo Colon. In the second half, he's throwing his heater about 67%. The difference is even more pronounced in two-strike counts: 66% fastballs in the first half, and slightly under 54% in the second half.

In place of those fastballs, Cole is snapping off signifcantly more short-breaking, upper 80s sliders (six percent overall in the first half, 21% in the second half). He's throwing his low-80s curveball at about the same frequency (12% in the first half, 10% in the second). Cole is using his slider and curve as chase pitches far more often in the second half, particularly with two strikes:

Location of Cole's slider and curveball in two-strike counts during the first half


Location of Cole's slider and curveball in two-strike counts during the second half

Cole threw 44% of his two-strike sliders and curves in the strike zone during the first half, well above the 39% big league average for starters in such situations. In the second half, he's throwing just 33% of his two-strike breaking balls over the plate. Cole got eight strikeouts with his slider and curve in the first half. During the second half? Thirty.

Throwing more breaking pitches out of the zone has helped Cole put hitters away in two-strike counts. Opponents hit .246 and slugged .290 against Cole when down to their last strike during the first half (starters overall allow a .172 average and .257 slugging percentage in two-strike counts). Now that he's using his slider and curve, he's limiting batters to a .151 average and a .264 slugging percentage with two strikes. Starter or reliever? Only Huntington and manager Clint Hurdle know. Either way, Cole looks postseason-ready.

Page 1 2 3 4 ... 4 Next 3 Entries »