Why the Yankees have gone 23-28 Since May 26
 Bill Chuck - Managing Editor |
 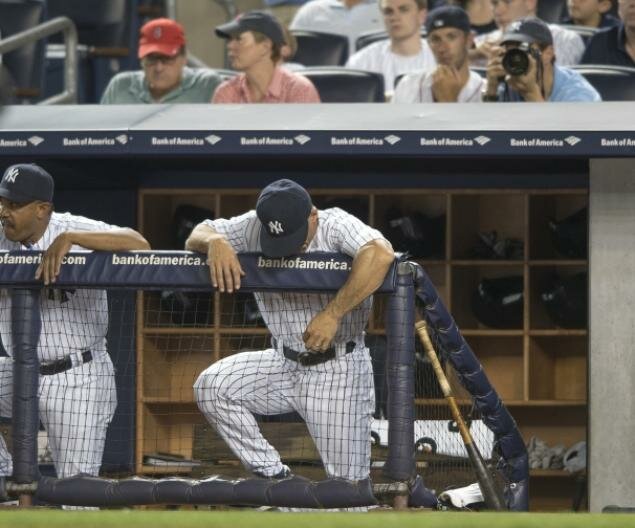 This is not a look at the injuries, turmoil, or the budgetary restrictions of the 2013 New York Yankees.
To quote Dragnet's Joe Friday, "Just the facts, ma'am."
Since May 26
After play on May 26, the Yankees were 30-19 (.612) and basically tied with the Red Sox who were 31-20 (.608) for first place. Since that date, the Yankees have been 23-28 (.451) the third worst record in the AL, only "better" than the Astros 20-29 (.408) and the White Sox 15-34 (.306).
With their victory last night, Boston for the 58th consecutive day remained in first place in the AL East, but don't be misled by that, they have only pulled away from the Yankees and Jays (24-25). Boston and Baltimore each have played 30-21 ball since then and the Rays have a 34-18 record, the best record in baseball since that date.
So what's gone wrong for the Yankees?
Nine to Know since May 26:
- The Yankees are hitting .238 as a team, the Astros at .223 are the only team with a lower batting average.
- The Bronx Bombers have hit 27 homers, only the Giants with 24 have hit fewer long balls.
- The Yankees have a .303 OBP, topping only the Marlins (.299) and the Astros (.284).
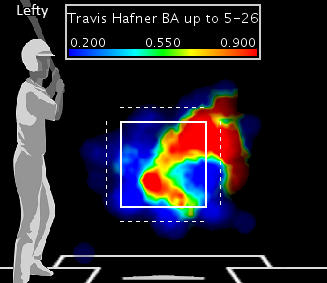
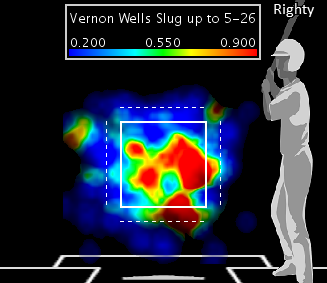
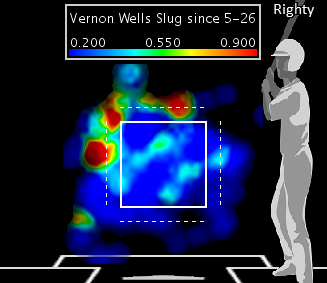
- Travis Hafner has hit .160 with four homers and Vernon Wells has hit .207 with no homers.
- The 3-4-5 batters have a slash line of .221/.294/.337.
- From the 7th inning on, the Yankees are hitting .213 tied with the Brewers for the worst BA in baseball.
- Yankees from the right side of the plate are hitting .206/.267/.253. Their .520 OPS is the worst in baseball (the Tigers righties' OPS is .807).
- Andy Pettitte is 3-4 with 5.04 ERA and 1.410 WHIP.
- CC Sabathia is 5-4 with a 4.80 ERA and a 1.212 WHIP.
Should Joe Girardi be manager of the year?
This has been a trying season for Yankee Universe and there is no indication that it is going to get much better.
Brian Cashman keeps working the phones, Joe Girardi keeps working on keeping his non-injured players looking for wins, and the press keeps working on the impending Alex Rodriguez bombshell.
The fact that the Yankees are just seven back in the AL East and just 5.5 back in the AL Wild Card race has some people talking about Girardi as Manager of the Year.
While Girardi would appreciate this memorable honor, I'm sure in future years Girardi will be doing everything he can to forget this season, not remember it.
Yankees | tagged