0-0: First Pitches, Much About Something
 Bill Chuck - Managing Editor |
 Getting ahead of batters is a stat that can never be minimized which why the first pitch of an at bat is so critical. That first pitch sets the tone for the at bat as the pitcher creates the mosaic of an at bat.
But that first pitch is dangerous for pitchers
So far this season, batters are hitting .343 with 278 homers on the first pitch of an at bat. This is slightly better than the 1-0 count in which batters are hitting .337 with 178 homers and a lot better than the .303 and 151 homers they hit when down 0-1.
Let's look at the leaders in the variables associated with the first pitch.
Nobody has faced more batters than:
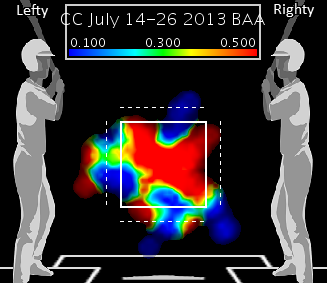
- CC Sabathia - 850 PA
- Adam Wainwright - 846 PA
- James Shields - 835 PA
Nobody has produced more balls in play on the first pitch of an at bat than:
- Patrick Corbin - 127 PA
- Kyle Kendrick - 121 PA
- Bronson Arroyo - 113 PA
Nobody has allowed more hits on the first pitch of an at bat than:
- Cole Hamels - 42 hits
- Mike Leake - 38 hits
- Jeff Samardzija - 38 hits
- Bronson Arroyo - 38 hits
Nobody has allowed fewer hits on the first pitch of an at bat than:
- Chris Tillman - 16 hits
- Felix Doubront - 17 hits
- Yu Darvish - 17 hits
Nobody has allowed more homers on the first pitch of an at bat than:
- Ervin Santana - 8 homers
- Dan Haren - 7 homers
- CC Sabathia - 7 homers
Nobody has allowed fewer homers on the first pitch of an at bat than:
- Clayton Kershaw - 0 homers
- Matt Harvey - 0 homers
- Jeff Locke - 0 homers
Nobody has produced more swings on the first pitch of an at bat than:
- Patrick Corbin - 283 swings
- Cole Hamels - 272 swings
- Justin Verlander - 258 swings
Nobody has produced more swings and misses on the first pitch of an at bat than:
- Matt Harvey - 71 swings and misses
- Yu Darvish - 69 swings and misses
- Justin Verlander - 68 swings and misses
- Mat Latos - 68 swings and misses
Nobody has produced fewer swings and misses on the first pitch of an at bat than:
- Scott Feldman - 19 swings and misses
- Bronson Arroyo - 21 swings and misses
- Kevin Correa - 22 swings and misses
Nobody has produced more called strikes on the first pitch of an at bat than:
- CC Sabathia - 326 called strikes
- Chris Sale - 324 called strikes
- CJ Wilson - 313 called strikes
Nobody has produced fewer called strikes on the first pitch of an at bat than:
- Jerome Williams - 176 called strikes
- Zack Greinke - 177 called strikes
- Miguel Gonzalez - 189 called strikes
Nobody has a lower batting average against on the first pitch of an at bat than:
- Kris Medlen - .245
- Jorge de la Rosa - .247
- Clayton Kershaw - .248
Nobody has a higher batting average against on the first pitch of an at bat than:
- Dan Haren - .486
- Ryan Dempster - .476
- Rick Porcello - .464
Nobody has produced more 1-0 plate appearances than:
- Kevin Correia - 77 PA
- Mike Leake - 72 PA
- Jeremy Guthrie - 72 PA
- Edwin Jackson - 72 PA
Nobody has produced fewer 1-0 plate appearances than:
- Dan Haren - 30 PA
- Tommy Milone - 30 PA
- Ryan Dempster - 34 PA
- Shelby Miller - 34 PA
Chipper Jones on going after the first pitch:
“There are certain pitchers, quite frankly, that you can’t get behind,” Jones said. “You want to be aggressive and the first hittable fastball that you get is the pitch you want to put in play. Because they’ll bury you if they get ahead of you. You can’t let them do that.”