Search Archives
Contributors
  • Bill Chuck - Managing Editor
  • Dave Golebiewski
  • Daniel McCarthy
  • David Pinto
  • Jonathan Scippa
Follow Us

Featured Sponsors


What's New

Mailing List
Email Newsletter icon, E-mail Newsletter icon, Email List icon, E-mail List icon Sign up for our Email Newsletter
For Email Marketing you can trust
Twitter Feeds

This site utilizes the MLB analytics platform powered by TruMedia Networks

Wednesday
Oct132010

Cliff's Cutter

During last night's TBS broadcast, Ron Darling commented on how well Cliff Lee had commanded his cutter. Here's a look at the heatmap: 
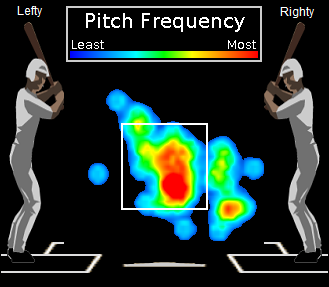
Pitch frequency of Cliff Lee's cutter in Game 5 against the Rays (38 pitches).By comparison, here's Game 1: 
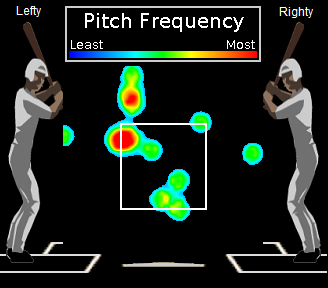
Pitch frequency of Cliff Lee's cutter in Game 1 against the Rays (13 pitches). Interesting note: In Game 1, Cliff Lee threw only one cutter to a lefty. In Game 5, 16 of his 38 cutters were thrown to lefties.
Monday
Oct112010

Cliff Lee's Game One

On October 6, Cliff Lee pitched 7 great innings against the Tampa Bay Rays earning the Texas Rangers a win in Game 1 of the ALDS.  He struck out 10, walked 1, and yielded one run on a HR to Ben Zobrist.  He held Rays batters to a .185/.185/.333 line and a .261 wOBA (when factoring in SB/CS weights).

Cliff Lee's Pitch Frequency to Lefties in Game OneCliff Lee's Pitch Frequency to Righties in Game One

 While the numbers indicate that Lee dominated Rays hitters, Tampa Bay did have a few chances to put more runs on the board.  In the first inning, the Rays had the bases loaded with one out before Lee struck out the next two batters to get out of the inning unscathed.  In fact, Lee managed to strike out 5 batters in the 7 PAs in which he faced runners in scoring position.

Rays batters also squared up Lee's fastball fairly well, scattering five line drives throughout the game.  Fortunately for Lee, 4 of those 5 line drives were caught for outs.  In 2010, Lee had a LD% of 16.5%, slightly below his career rate of 19%.  In Game One, those 5 line drives resulted in a LD rate of 24.5%.  Small sample size, of course, but Lee certainly benefited from a slightly lower than average BAbip (.250) in the first game of the series.  Should the Rays hitters manage to cut down on their strike outs in Game 5, a correction in BAbip may result in increased scoring opportunities against Lee.

Friday
Oct082010

Phil Hughes at Home

It’s no secret that New York Yankees starter Phil Hughes has performed far worse at home this season. Unfortunately for him, he’ll be making his first postseason start at Yankee Stadium on Saturday in Game 3 of the ALDS against the Minnesota Twins.

ERA FIP CERA K/9
Home 4.66 5.18 4.20 7.03
Away 3.47 3.14 2.89 8.10

As you can see, Hughes has underperformed his FIP on the road this season while outperforming it at home, although the differences aren’t terribly large. He’s also seen a drop in his strike out rate at home accompanied by a slight uptick in his walk rate.

Hughes has held batters to a noticeably lower line on the road.
BA OBP SLG BAbip wOBA
Home .248 .312 .443 .262 .329
Away .238 .288 .336 .293 .278

The most glaring difference is the 107 point jump in SLG% at home. Hughes has yielded 20 HRs at home this season compared to just 5 on the road. While it would be easy to attribute Hughes’ poor home stats to Yankee Stadium’s dimensions, there are probably a number of other issues factoring in to the problem. However, the rest of his line is not all that worse at home outside of SLG%. In fact, his relatively low BAbip at home further suggests that HRs have been his biggest problem, as his BA and OBP against are only slightly inflated at Yankee Stadium. Keeping the ball in the yard will be priority number one for Hughes this Saturday to say the least.
Page 1 ... 472 473 474 475 476 Next 3 Entries »